

Section 8 Housing Overview
Geographic distribution of Section 8 properties, gross rental yields, property types, and more.
Executive Summary
Section 8 housing is primarily concentrated in large cities, with the top 10 cities accounting for almost 20% of all Section 8 properties nationwide. Chicago, Philadelphia, and San Antonio have the largest number of Section 8 units.
Gross rental yields for Section 8 properties range from 15%-to-18%+ annually in the largest markets, offering attractive returns for investors. Out of state investors have been purchasing significantly in high-yielding markets, with some states approaching 40%+ out of state ownership.
Heat maps reveal clustering of Section 8 properties in lower-income urban neighborhoods within major metros. However, Section 8 properties are found across a range of ZIP codes.
At the end of the article, a spreadsheet is available breaking down the largest owners.
Note: To generate this report, we gathered data from online listing portals that showcase Section 8 rentals; because of this approach, the data may not be representative of the total market.
Interested in property investment activity in real-time? Check out the SFR Analytics Buyer Tool: https://app.sfranalytics.com/buyers
Introduction
The Section 8 housing program, also known as the Housing Choice Voucher program, is a federal government initiative that provides housing assistance to low-income families, the elderly, and persons with disabilities. Participants in the program receive vouchers that they can use to rent housing in the private market, with the government subsidizing a portion of the rent.
In this article, we dive into trends in the Section 8 housing market using data collected from public sources. We examine the geographic distribution of Section 8 properties, gross rental yields achievable for investors, common property types, and heatmaps showing the clustering of Section 8 units within major metros.
Analysis & Results
Geographic Distribution
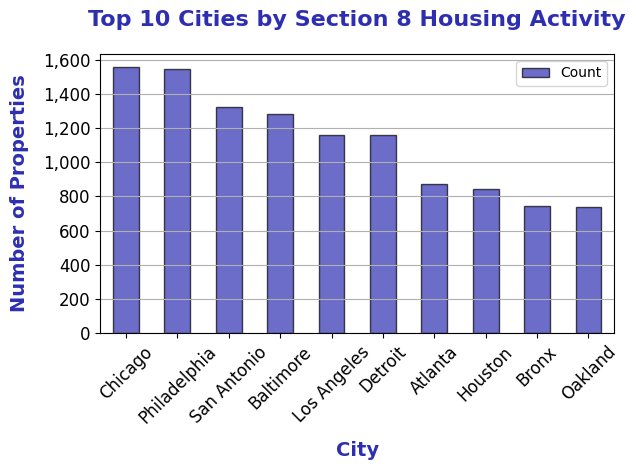
Section 8 properties are heavily concentrated in major metropolitan areas. The top ten cities account for almost 20% of all Section 8 properties nationwide.
Property Type Breakdown
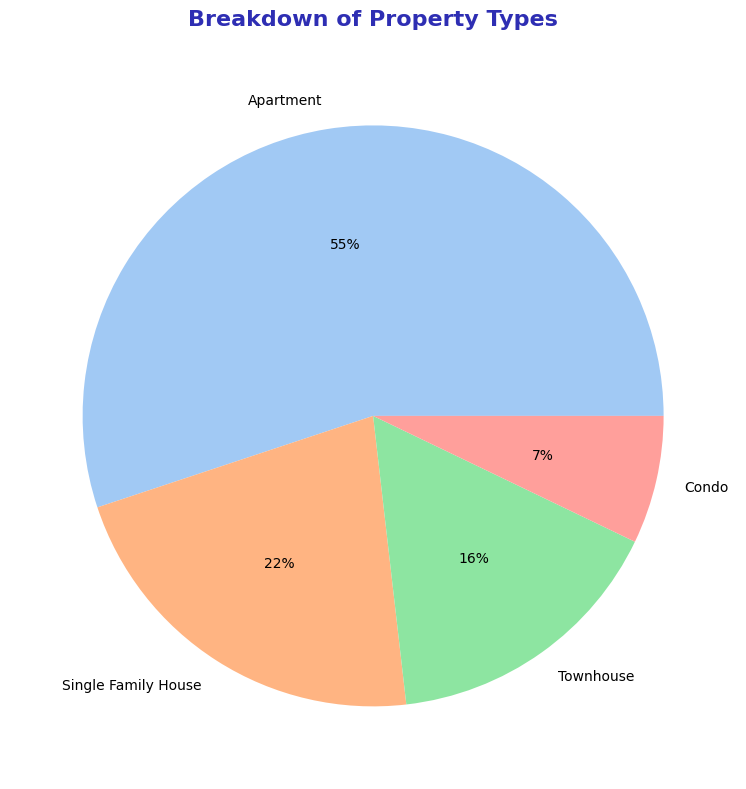
The majority of Section 8 units are apartments, followed by single family homes, townhouses, and condos.
Gross Rental Yields
Section 8 properties offer attractive gross rental yields, especially in lower cost markets like Detroit and Philadelphia. While still attractive, gross yields are lower in expensive markets like Brooklyn, NY and Los Angeles, CA. Gross yield is calculated as annual rental income divided by property value.
For comparison, median gross yields for market-rate single family rentals typically range from 5-12% depending on the metro, as profiled in our recent piece 2023 SFR Rental Acquisitions Overview.
The higher yields for Section 8 reflect the subsidized rents and lower property values in the neighborhoods where Section 8 housing is common.

Out-of-State Landlords
The rate of properties owned by out of state owners differs significantly across states, with rates in New York and California below 10% but higher than 35% in Missouri and Alabama.
Comparing the median AVM value of properties against the rate of out-of-state ownership reveals an inverse relationship, with lower value properties tending to have a higher rate of out-of-state ownership.
California had the longest median time since property purchase at 9 years vs Maryland and Alabama at close to 3 years, signaling that investors (often out of state) are chasing yields in areas that still offer them.


Corporate Ownership
Like out-of-state ownership, corporate ownership rates vary significantly across markets, from lower values of 40%-50% to higher values of 65%-70%+.

Geographic Dispersion
While cities like Chicago and Los Angeles have dense clusters that have some separation from the surrounding city areas, Section 8 housing within Philadelphia, San Antonio, and Baltimore is more dispersed.
Los Angeles

Chicago

Philadelphia

San Antonio

Baltimore

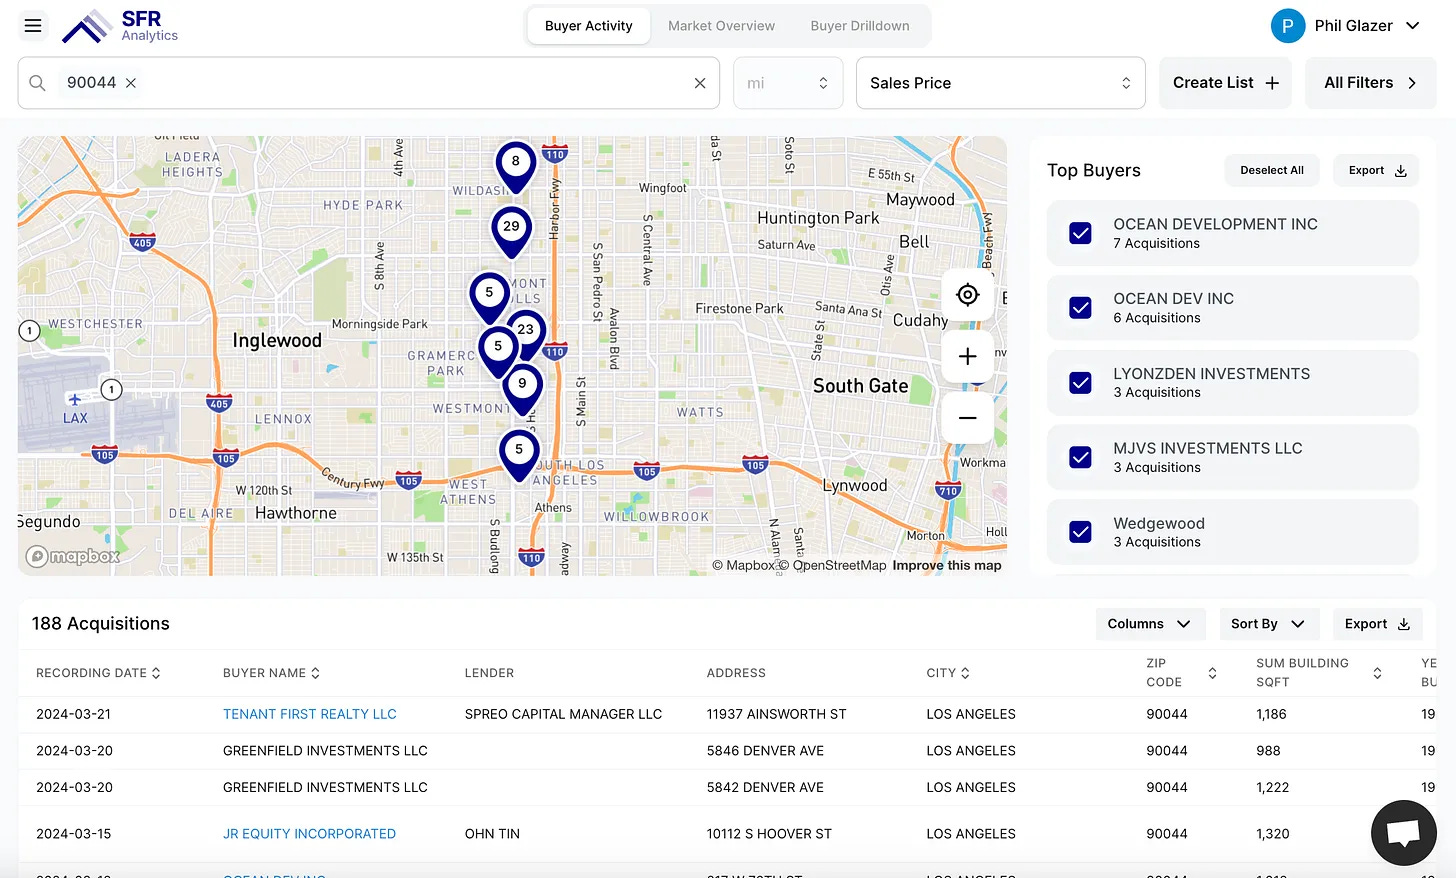
Property-level Details
Looking at property-level details reveals interesting trends in the type of deals a given investor has done (location, property type, price, etc).
Note: the remainder of this article is available to paid subscribers, sign up below for access. Paid subscribers get full access to weekly data-rich articles about the SFR market and select additional articles only available to paid subscribers.