

The ZIP Codes With Highest Investment Activity
Baltimore ZIP Code Clocks In With 80%+ Investor Purchases
Executive Summary
We looked at year-to-date single family investor purchases nationwide to identify geographic trends and concentration of investor activity across markets.
The highest-ranking ZIP Code showed over 80% of single family homes purchased by LLCs or using private lenders, primarily targeting distressed properties requiring significant rehabilitation.
Top-performing ZIP Codes consistently demonstrated extremely low price points, with leading ZIP Codes in each state exhibiting relatively low median home values compared to state averages.
This analysis focuses exclusively on single family purchases, defining investor activity as transactions financed through private lenders or completed by LLCs. Institutional buyers (hospitals, counties, universities, etc.) were excluded to isolate true investor activity.
Top Investor Activity ZIP Codes By State
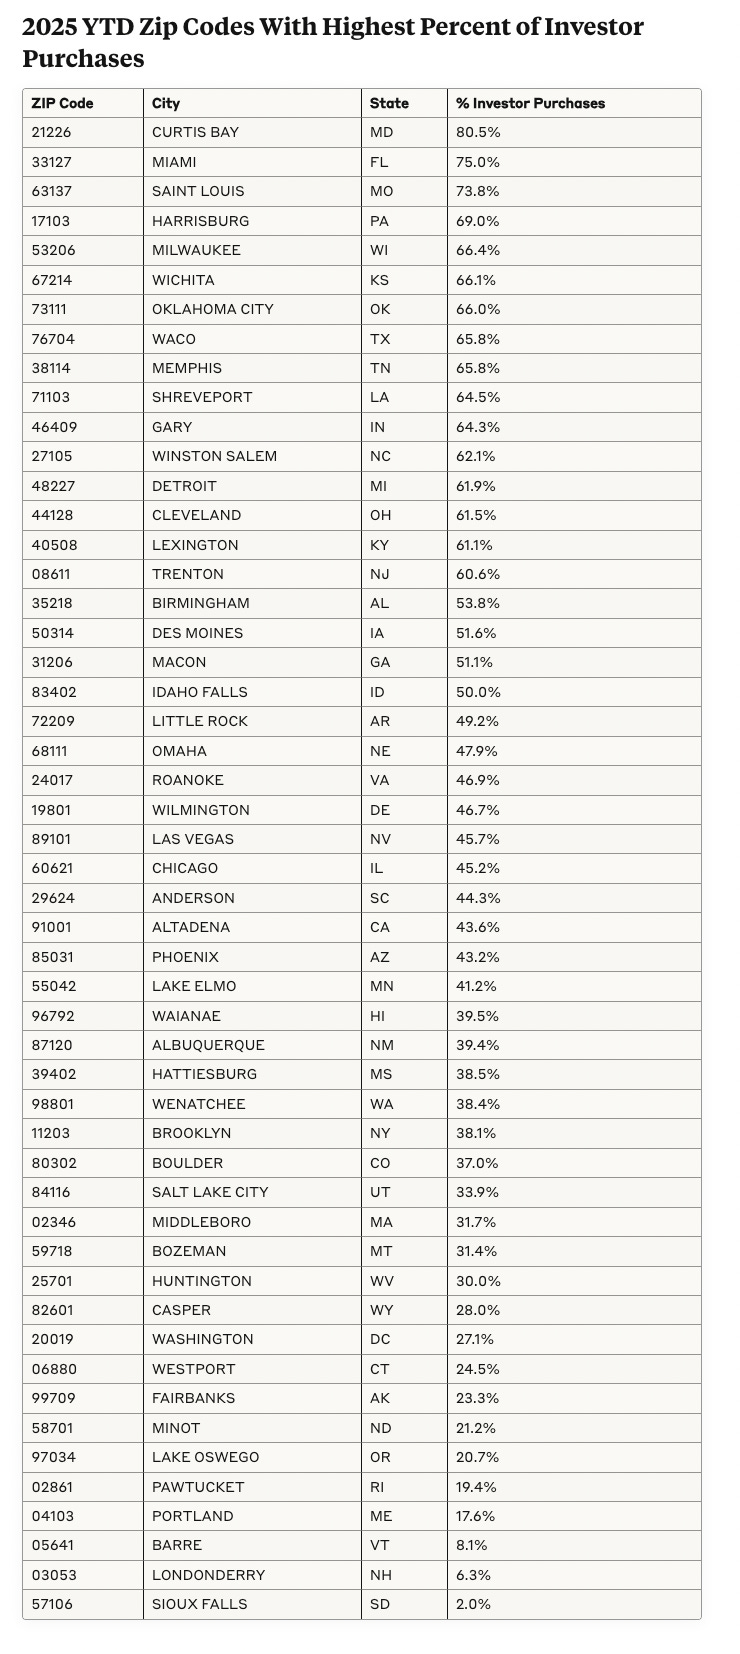
Note: ZIP Codes with fewer than 30 transactions YTD were excluded.
Investor strategies vary significantly by geographic market. High-cost regions like California and Colorado feature ZIP Codes with after-repair values (ARVs) approaching or exceeding $1 million. In contrast, top investor markets in Baltimore, Saint Louis, and Milwaukee demonstrate median purchase prices below $100,000, representing some of the most affordable properties in their respective states.
The plot below shows each ZIP Code's median home value against its percentage of investor purchases. Among the top 20 investor-active ZIP Codes, a clear clustering pattern emerges around very inexpensive properties, predominantly below $100,000.
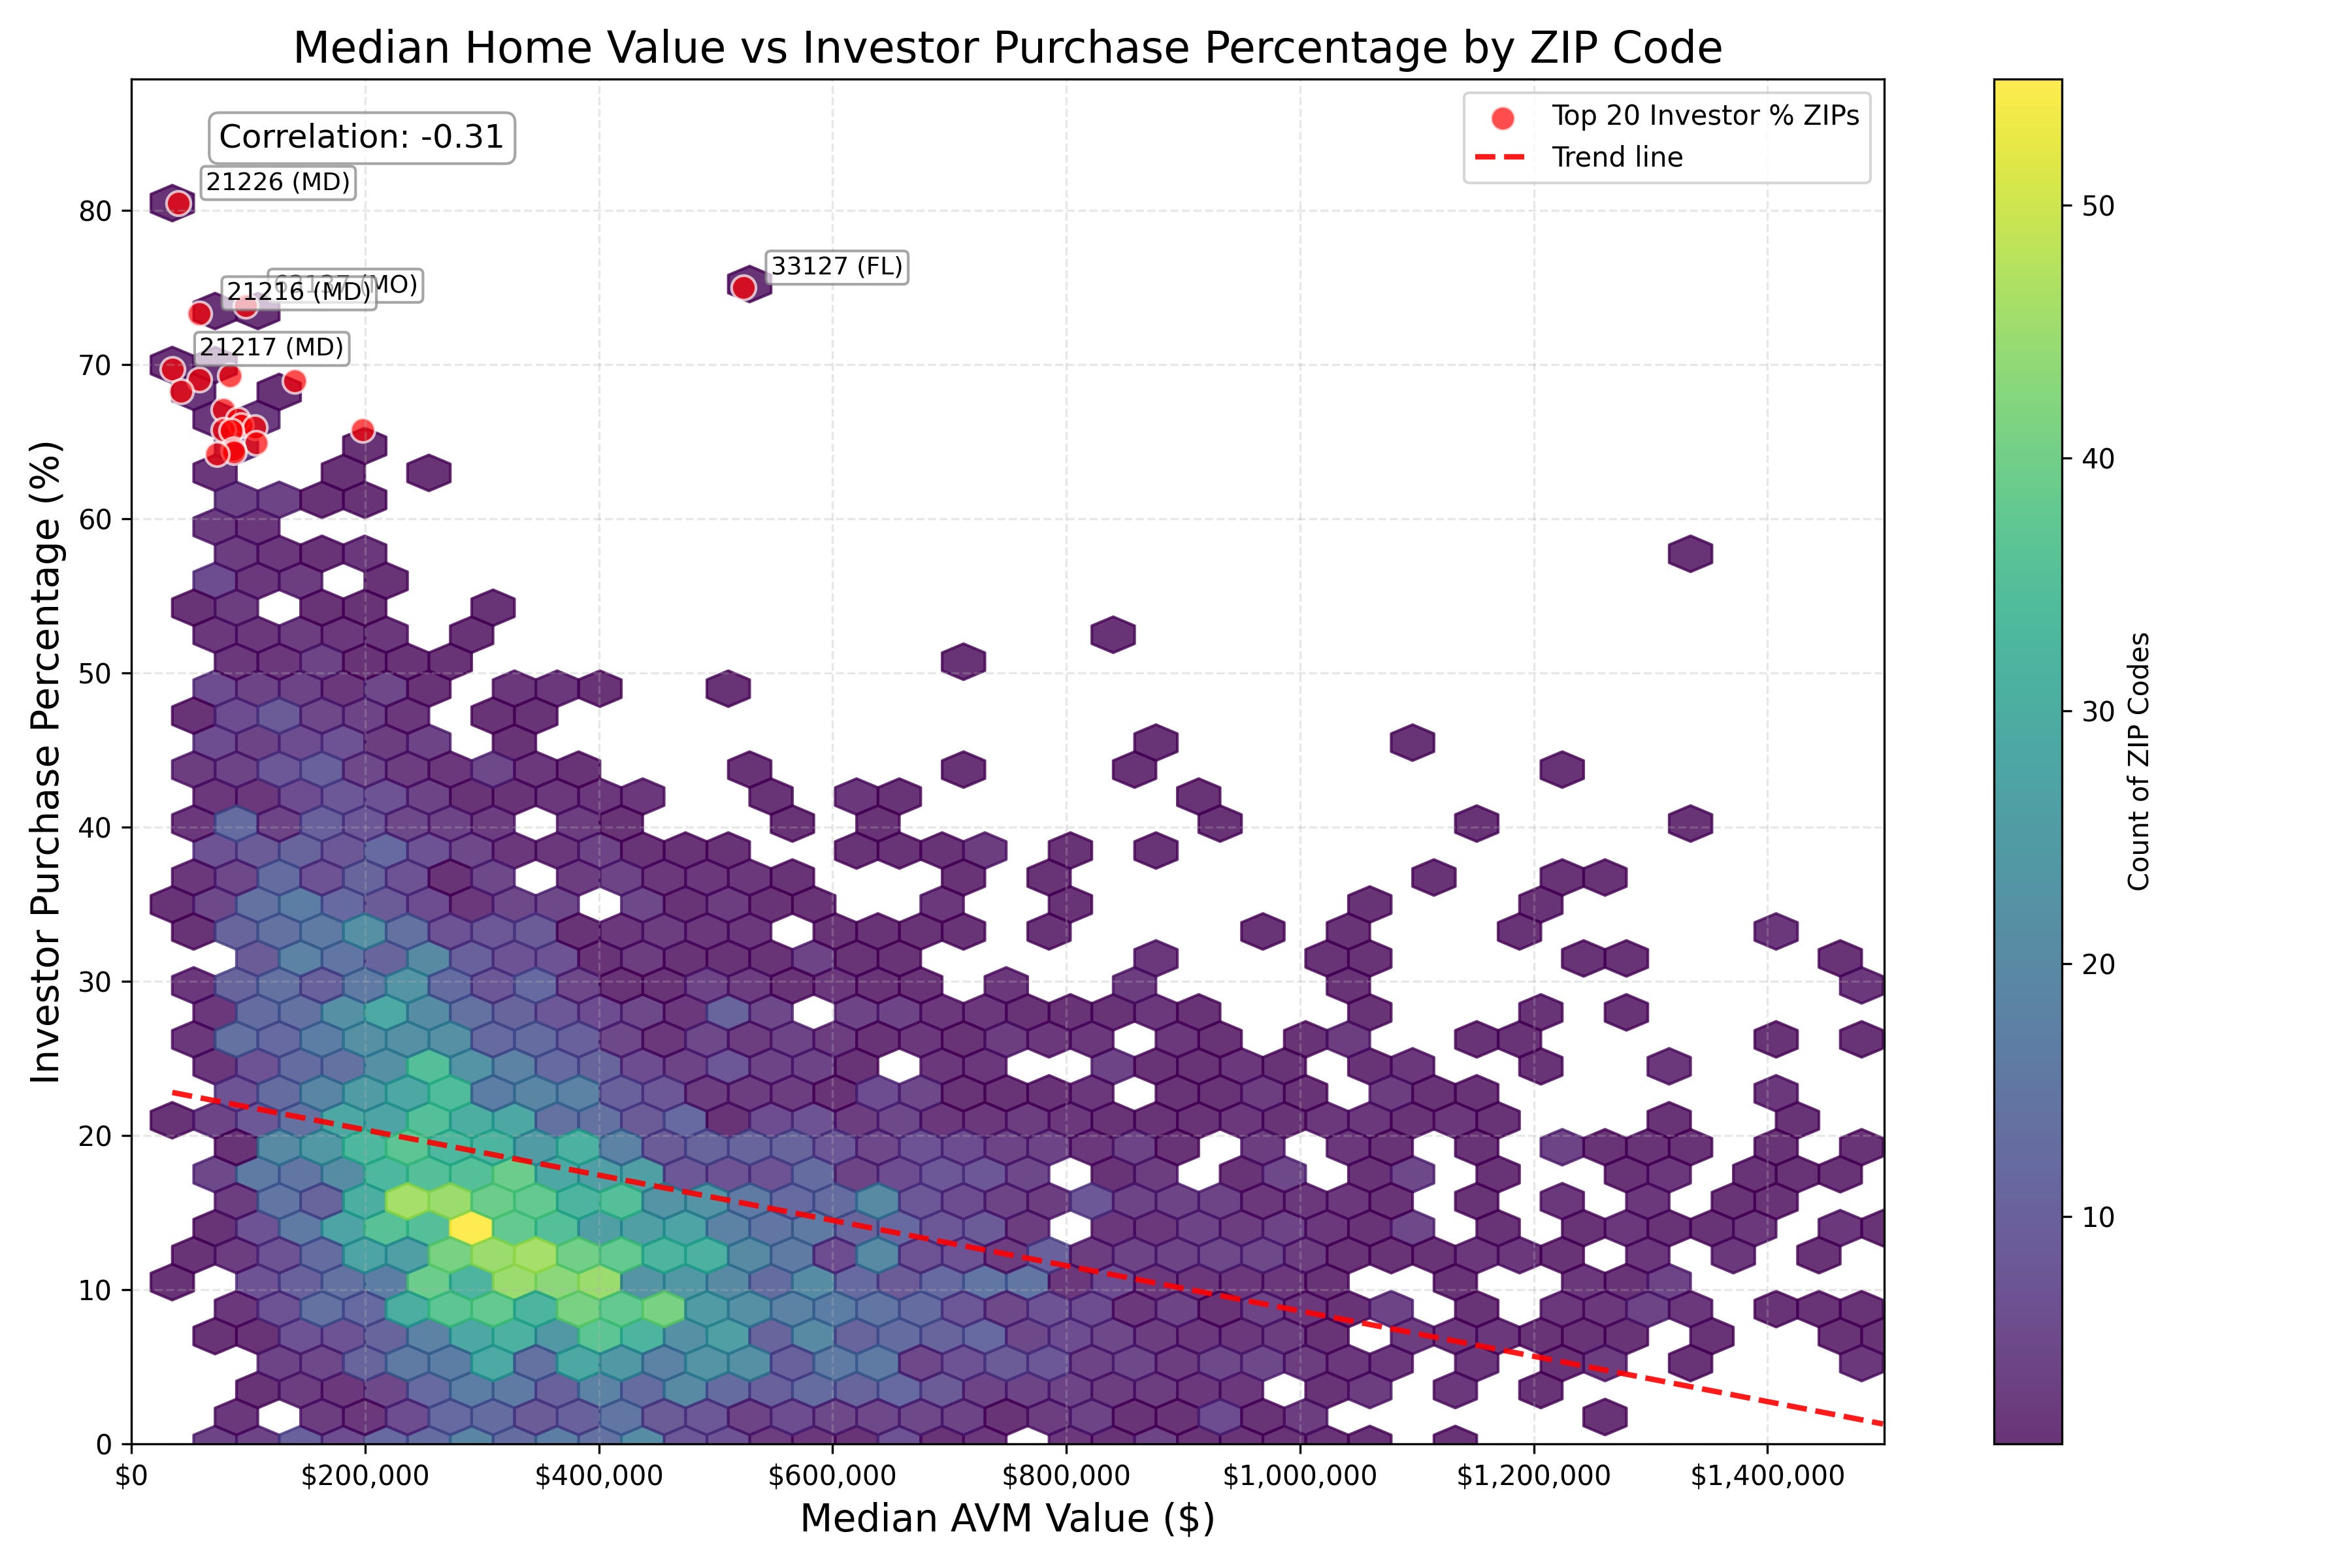
The concentration in lower-priced markets aligns with current high interest rate conditions. These properties offer several advantages: they're more accessible for cash purchases, generate higher yields, demonstrate superior cash flow even with financing, and present viable renovation opportunities. Low-cost markets provide investors significantly more strategic flexibility compared to high-priced regions like California, where gross yields often fall below 4%.
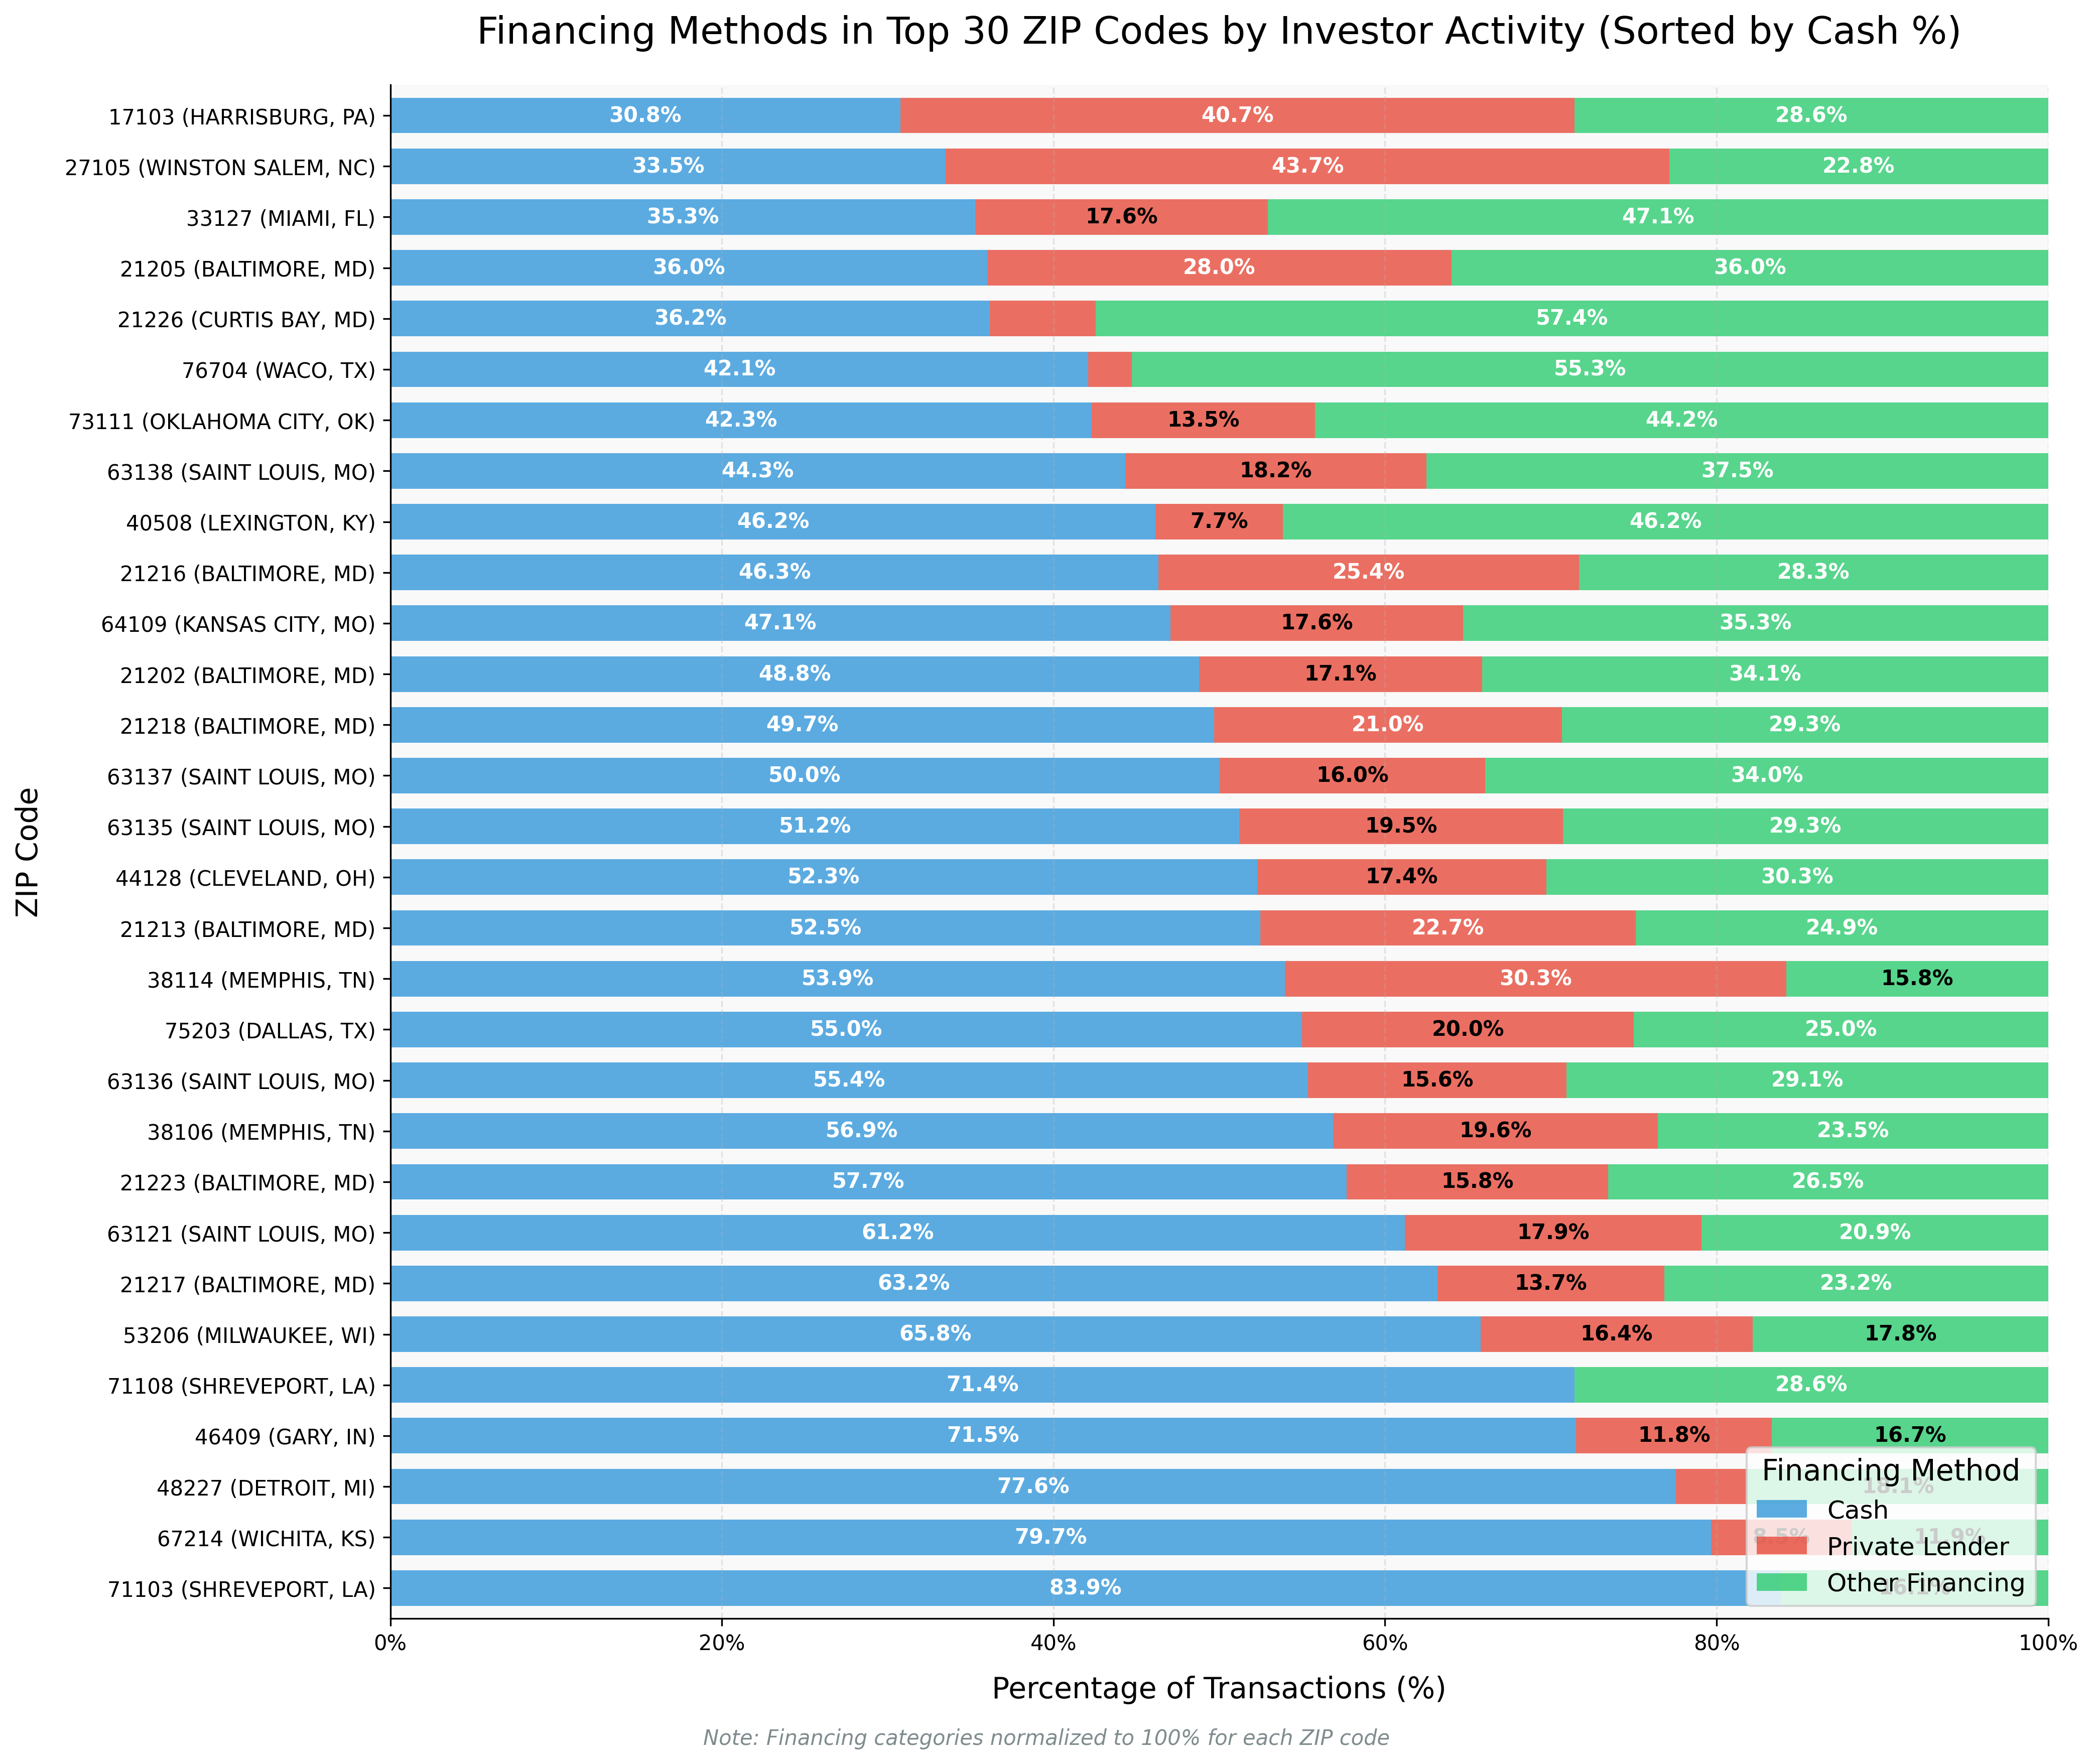
Financing Patterns Across MSAs
Analysis of the 30 ZIP Codes with highest investor activity reveals diverse financing approaches. Private lending typically accounts for 15-20% of investor purchases across most markets, while conventional lenders and regional banks offering business-purpose loans constitute the majority of remaining financing sources.
Raw Data
If you’re interested in the raw data for all the ZIPs we analyzed, paid members can access the spreadsheet below.