


Single Family Rental Listings Are Dominated By Small Investors
An analysis of 120,000+ single-family properties listed for rent, including gross yield by geo, institutional vs individual ownership, and more.
Executive Summary
Using data collected internally, we’ve identified 120,000+ single-family homes currently listed for rent.
Gross yields for listed properties vary significantly by MSA, with median values ranging from 10% to 15%+ nationwide (Note: the gross yield is calculated by dividing the annual rental income, monthly rent * 12, by the entry purchase price. It's worth noting that properties purchased many years ago may report higher gross yields due to the appreciation in home prices over time.).
The post explores gross yields across a variety of metro areas and rental price distributions within those metro areas.
Of the single-family rentals currently listed, approximately 18% are institutionally owned, while small landlords owning between 1 and 4 homes account for 62%.
Message us if you’d like to receive the listings data daily. Current use cases include: property managers for prospecting, lenders for prospecting DSCR loans, and hedge funds for tracking specific the rental performance of specific entities.
Data Overview
At SFR Analytics, we leverage nationwide deed, assessor, and rental listing data to track the single family rental market. To generate this analysis, we’ve:
Identified and reconciled the entities that SFR funds have purchased homes under
Matched rental listing data to the underlying ownership information that links an entity to an SFR fund
Note: this data is based on rental listings posted online. This data is likely biased towards having greater coverage of rentals by large operators, which use property management systems that syndicate rental listings across online portals. Some smaller rental operators choose not to post their rentals online and may not be fully represented in the data.
Analysis & Results
We analyzed 120,000+ single-family properties currently listed for rent to gauge the yields available to investors and how they vary by region.
Nationwide Gross Yields

Nationwide, most single-family homes listed for rent have a gross yield between 7% to 20% annually. In general, homes purchased at a higher price tend to offer a lower gross yield (homes at the lower end of purchase price may have renovation costs involved, meaning that the net yield to an investor after factoring expenses related to maintenance and operation would be lower).
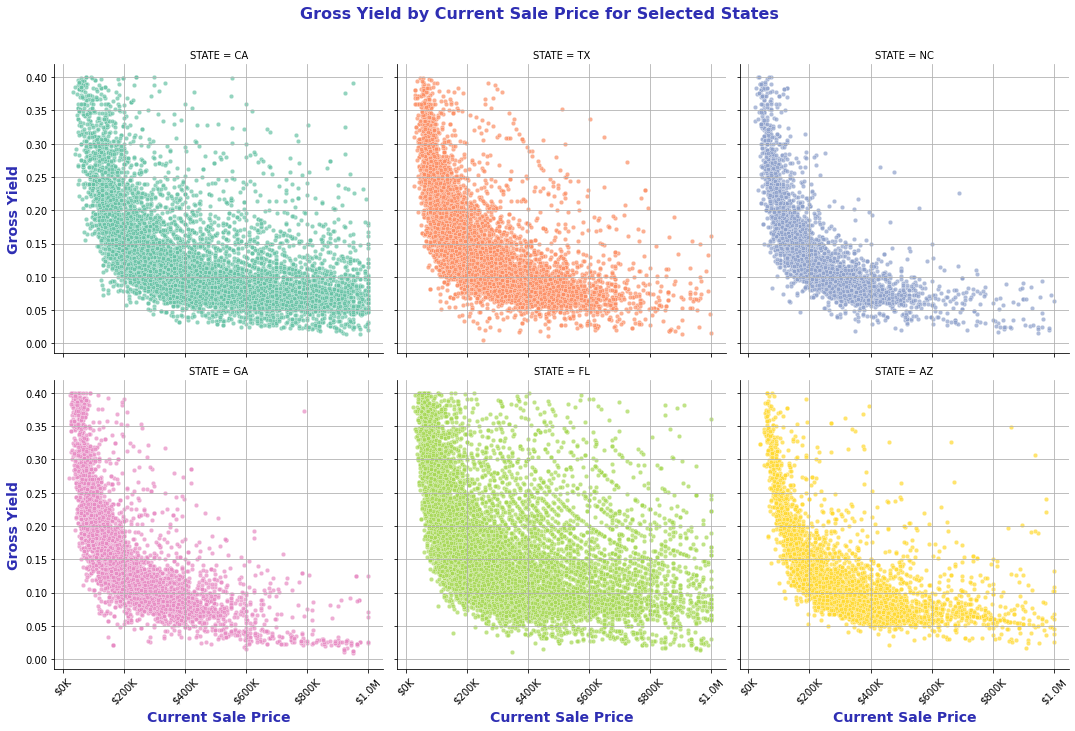
Across states, the relationship between purchase price and gross yields holds despite meaningful differences in purchase price. Of the states that have the most single family rental properties listed, Florida, California, and Texas have the highest concentration of 10%+ gross yields while Georgia and Arizona have significantly less.
Gross Yield by City

Gross yield varies meaningfully by city, ranging from a median value of ~10% in cities like Phoenix and Las Vegas to 15%+ in cities like Naples. Note: Naples is a seasonal market that may be inflated as rents are higher during winter months.
Institutional vs Non-Institutional Ownership Segmentation
Digging in further, there are notable differences by MSA in the percentage of rental listings owned by institutions vs non-institutional owners. Additionally, there are significant differences in the gross yields on properties owned by the different segments.

The scatterplot above shows the proportion of homes owned by small investors (1-4 homes) vs the number of homes owned by large investors (100+ homes). While many of the core SFR markets have between a 1 to 3 ratio, the vast majority of other metros are dominated by small landlords. In metros like Riverside, Austin, and New York, small landlords have 15+ homes listed for rent for every home listed by a large investor.
Note: the remainder of this article is available to paid subscribers, sign up below for access. Paid subscribers get full access to weekly data-rich articles about the SFR market and select additional articles only available to paid subscribers.