


SFR Investment Landscape Q1 2025: Markets in Transition After Price Correction
Metro-level analysis reveals strategic opportunities for investors as inventory conditions diverge dramatically across regions.
The single-family residential investment landscape has transformed dramatically in early 2025, with inventory growth, price corrections, and changing market liquidity creating both challenges and opportunities. Our analysis of Federal Reserve Economic Data (FRED) across 100 major metros reveals actionable insights for SFR investors navigating this shifting environment.
The Inventory Surge: A Fundamental Market Shift
The most striking development in Q1 2025 is the substantial increase in housing inventory across major SFR investment markets.

Key Inventory Growth Markets:
Denver: 64.4% year-over-year increase
San Diego: 61.3% year-over-year increase
Las Vegas: 60.8% year-over-year increase
Charlotte: 45.7% year-over-year increase
This inventory expansion may influence acquisition dynamics for SFR investors:
Enhanced selection: Markets with 45%+ inventory growth offer significantly more on-market properties to evaluate compared to 2023-2024
Potential reduced competition: In high-inventory markets, buyers may face less pressure during the acquisition process
Possible negotiating dynamics: Data suggests sellers in high-inventory markets (60%+ YoY growth) may need to adjust pricing expectations
Market variation: Some markets (New York at 1.0%, Detroit at 6.2%) show minimal inventory changes

Price Correction Patterns: Strategic Entry Points
Price data reveals significant regional variation, with a national average decline of 2.4% year-over-year masking more dramatic corrections in specific markets.
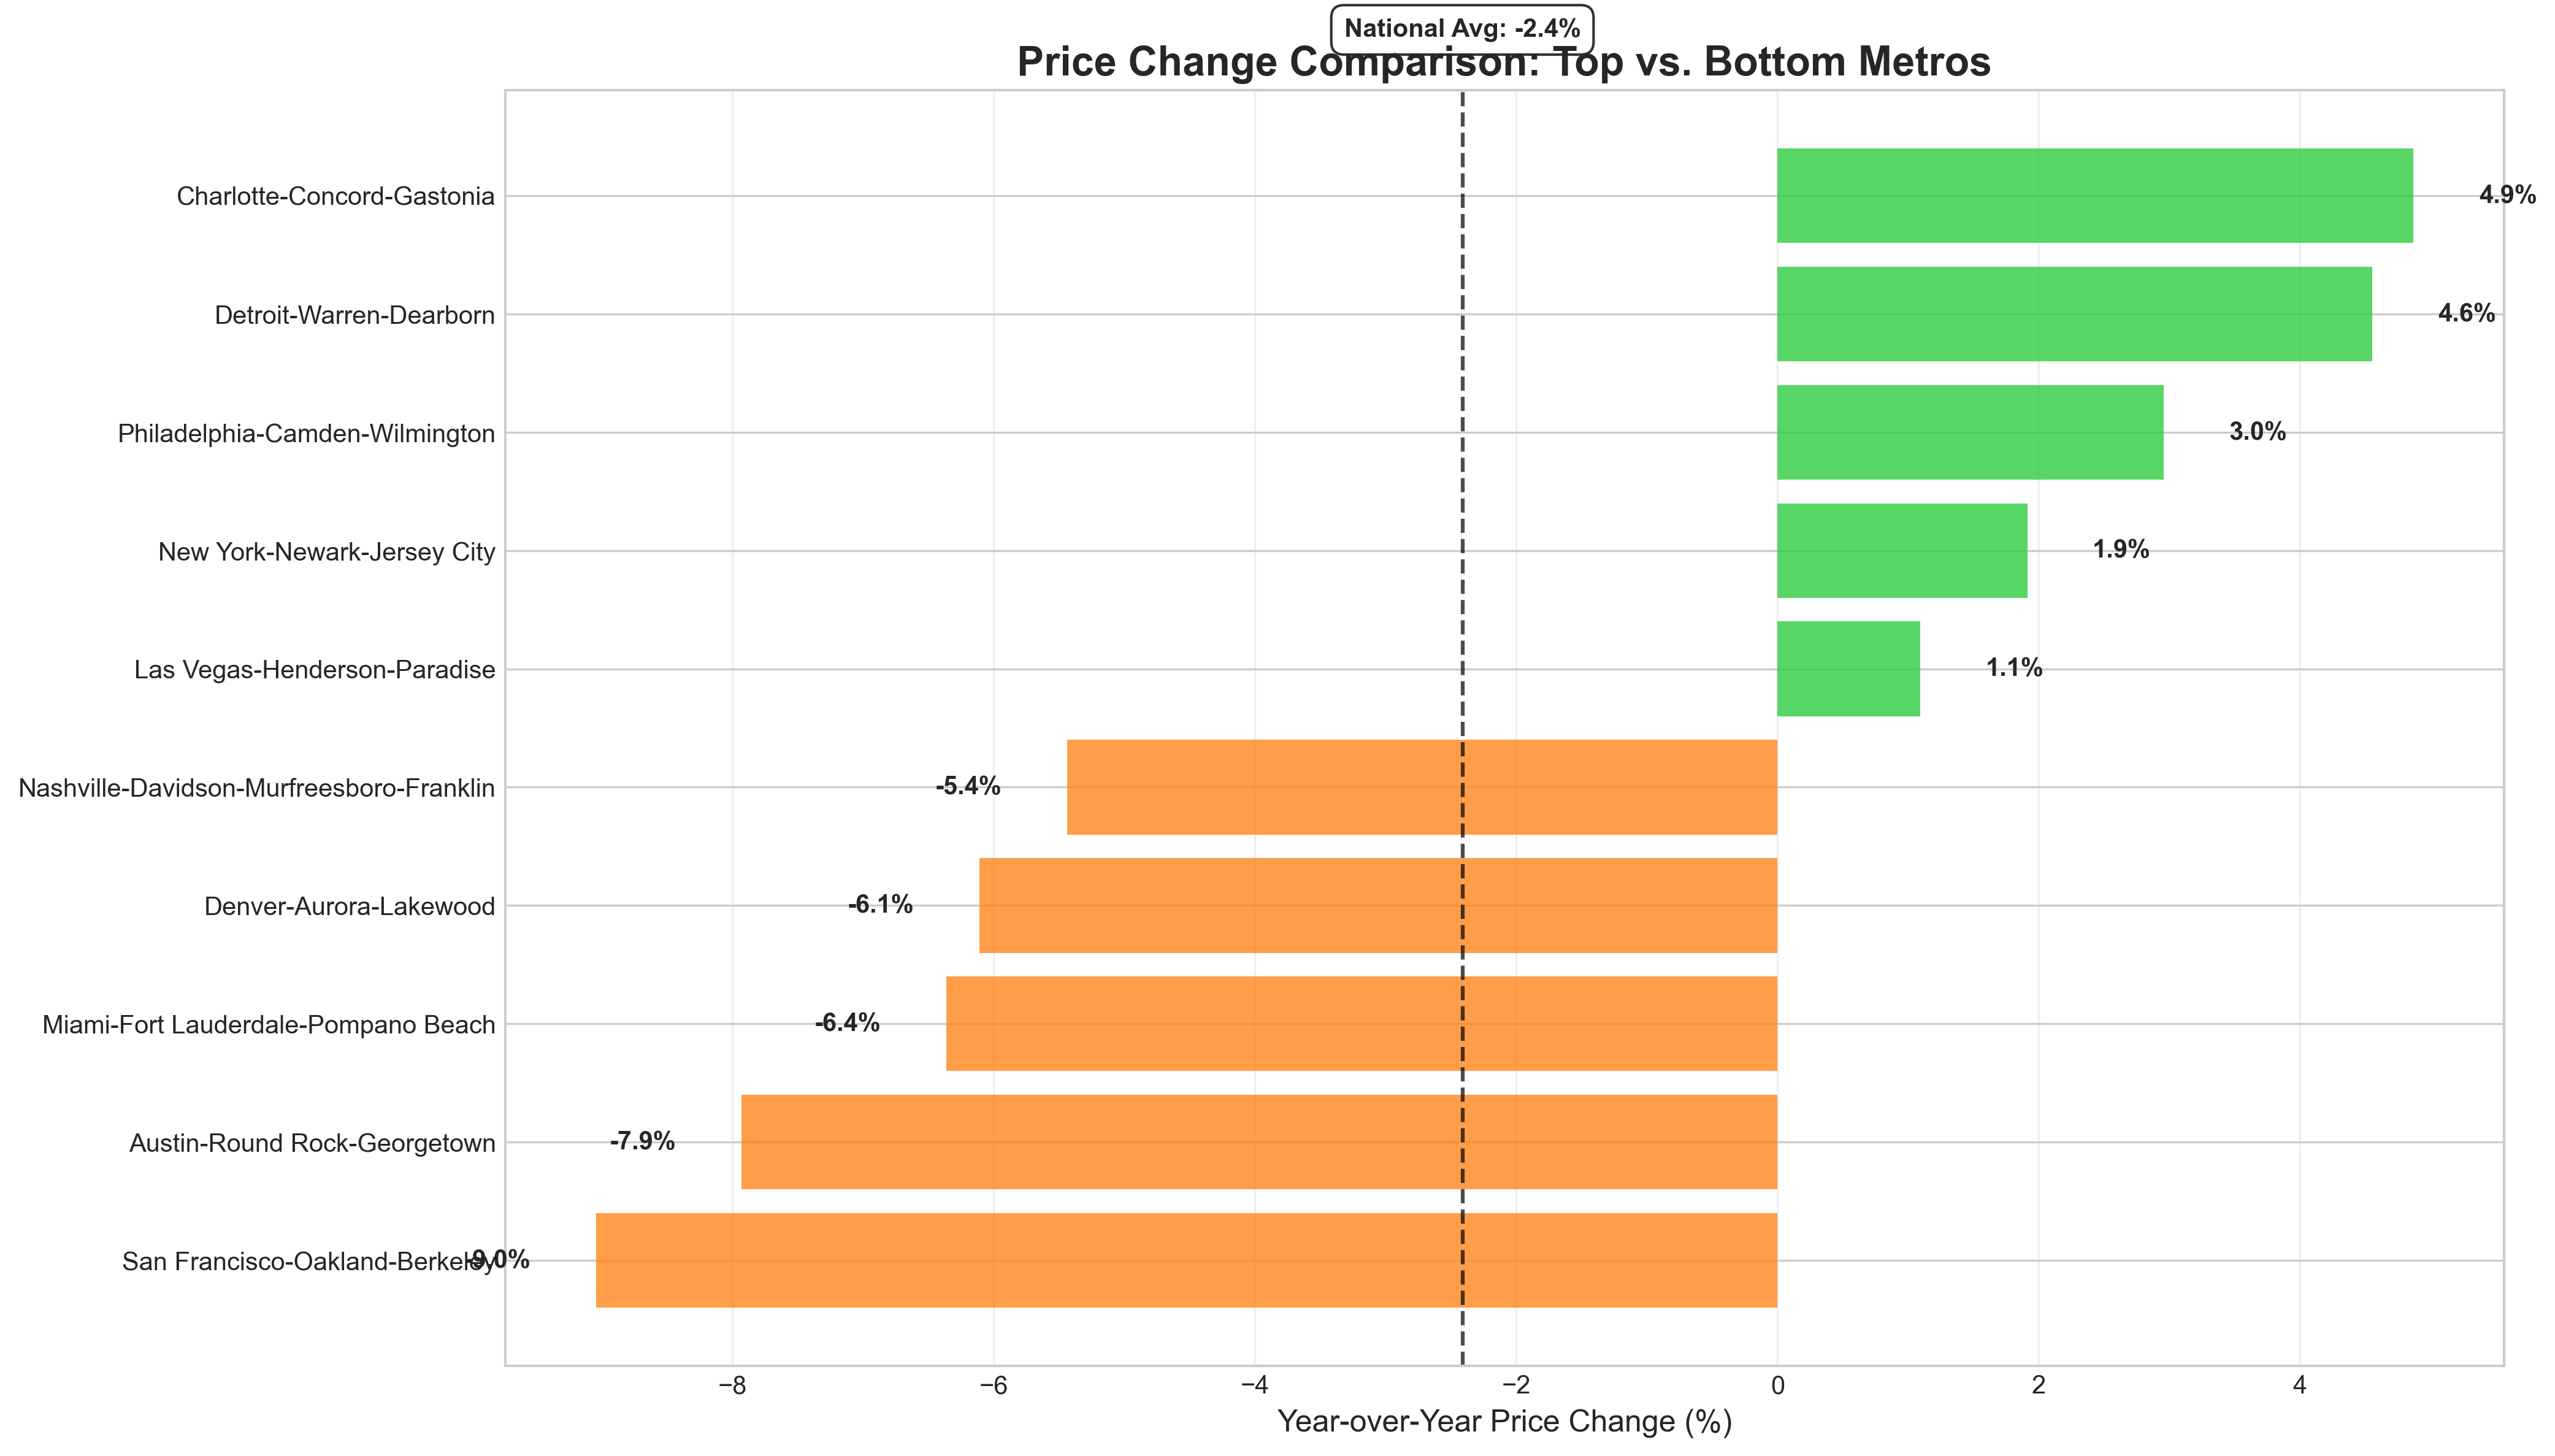
Markets with Largest Price Declines:
San Francisco: -9.0%
Austin: -7.9%
Miami: -6.4%
Denver: -6.1%
Nashville: -5.4%
Conversely, several markets continue showing price appreciation despite broader headwinds:
Charlotte: +4.9%
Detroit: +4.6%
Philadelphia: +3.0%
For yield-focused SFR investors, markets with significant price corrections while maintaining strong rental demand potentially offer improved acquisition opportunities compared to 2021-2023.
The time series data provides crucial context:

Between 2022-2025, we've witnessed a complete market cycle, from double-digit appreciation to the current correction phase. This pattern creates distinct entry strategies based on:
Correction depth: Markets with 6%+ declines may offer enhanced value
Historical context: Current prices relative to pre-pandemic levels remain elevated in most markets
Rental trends: Price declines without corresponding rent decreases improve yield potential
Market Matrix: Quadrant Analysis for Strategic Positioning
Our price-inventory matrix plots markets along these two critical dimensions, providing a framework for strategic decision-making:

Quadrant Analysis for SFR Investors:
Markets with Price Declines and Inventory Growth - Denver (-6.1%, +64.4%), San Diego, San Francisco
Characteristics: These markets show both significant YoY price decreases and substantial inventory expansion
Data implications: Combined price/inventory metrics suggest changing market equilibrium
Historical context: Previous buyer competition has shifted toward greater supply relative to demand
Markets with Minimal Price and Inventory Changes - Chicago, St. Louis
Characteristics: These markets show relatively stable metrics compared to national averages
Data implications: Limited deviation from prior year metrics suggests more gradual market evolution
Historical context: These markets typically demonstrate lower volatility through market cycles
Markets with Limited Inventory Growth - New York (+1.0%), Detroit (+6.2%)
Characteristics: Despite broader inventory trends, these markets maintain relatively tight supply conditions
Data implications: Supply constraints remain a defining characteristic despite national expansion trends
Historical context: These markets have consistently shown lower inventory elasticity
Market Liquidity: The Days on Market Challenge
Beyond price and inventory, market liquidity represents a critical consideration for SFR exit strategies and hold periods:

Markets with Significant DOM Increases:
Nashville: 41.0% year-over-year increase
Atlanta: 34.9% year-over-year increase
Denver: 25.7% year-over-year increase
Phoenix: 24.4% year-over-year increase
Charlotte: 24.4% year-over-year increase

The historical DOM trends provide context when viewed alongside other metrics:
While seasonal patterns remain evident, the data shows properties taking longer to sell in most markets, with increases ranging from 24.4% to 41.0% year-over-year. This DOM data may influence several aspects of investment analysis:
Timeline considerations: Historical data suggests correlation between extended DOM and longer holding periods before successful exits
Return component analysis: Markets with extended DOM historically show different appreciation/cash flow balances compared to rapid-turnover markets
Property positioning factors: DOM increases often correspond with changing buyer preference patterns and competitive dynamics
Financing implications: The data on extended marketing periods aligns with historical preferences for financing structures matched to anticipated hold duration
Market Condition Assessment: Comparative Analysis
Our market condition score (0-100) evaluates relative market risk by weighting year-over-year changes in key metrics: inventory growth (30%), price movement (30%), days-on-market increase (20%), and historical price volatility (20%). Higher scores indicate greater market uncertainty and potential investment risk based on rapidly changing conditions:

Highest Risk Markets (80+ Score):
Nashville: 85.9
Denver: 82.3
Miami: 80.8
Atlanta: 80.2
Phoenix: 80.2
These markets share common characteristics including significant price corrections, substantial inventory growth, extended days on market, and prior rapid appreciation during 2021-2022.
Moderate to High Risk Markets (70-80 Score):
San Francisco: 79.8
Dallas: 77.1
Orlando: 75.8
Tampa: 75.7
Austin: 74.6
Lower Risk Markets (Under 60 Score):
Boston
Minneapolis
Detroit
New York
Chicago
Conclusion: Adapting Investment Strategies for 2025
The Q1 2025 housing market data reveals significant regional variations across key metrics. Year-over-year inventory increases range from 1.0% to 64.4%, while price changes span from -9.0% to +4.9%. Days-on-market metrics show substantial increases in several previously high-velocity markets. This data suggests different market conditions compared to the 2021-2022 period.
Market Data Considerations for SFR Investment Analysis:
Markets demonstrate wide variation in key metrics with condition scores ranging from under 60 to 85.9
Price correction data shows -9.0% to +4.9% year-over-year changes, potentially influencing yield calculations
Inventory expansion ranges from 1.0% to 64.4%, creating different property selection environments across regions
Extended days-on-market metrics (up to 41.0% increases) may affect exit timing considerations
Significant regional variation suggests the importance of market-specific analysis rather than national strategy
While challenging for investors who built strategies around rapid appreciation and limited supply, the current market offers significant opportunities for those willing to adapt their approach and capitalize on the changing landscape.
Data source: Federal Reserve Economic Data (FRED) through March 18, 2025. Analysis by SFR Analytics.