


Public SFR REITs Breakdown - Invitation Homes, American Homes 4 Rent, Tricon
Public SFR REITs Breakdown - Invitation Homes, American Homes 4 Rent, Tricon
Property-level portfolio overview, school ratings, rent growth trends, price listing cuts, and more.
Executive Summary
Invitation Homes (NYSE: INVH), American Homes 4 Rent (NYSE: AMH), and Tricon (NYSE: TCN) have built a combined portfolio of 170,000+ single-family rental properties across the country.
Acquisition pace has slowed in 2023, but demand for SFR units from renters remains strong, and market conditions have driven a rise in interest for built-to-rent (BTR) projects.
While funds were able to grow annualized rent 10%+ during stretches of 2021, pricing power has diminished and is <5% these days.
Detailed information about real-time data on listings price cuts and new lease rent growth trends for INVH, AMH, and TCN for paid subscribers at the end of the article.
New lease rent growth is a key input to total portfolio rent growth; paid subscribers have access to this data ahead of quarterly earnings calls.
Introduction
Single-Family Rental (SFR) Real Estate Investment Trusts (REITs) have become a prominent player within residential real estate. Today, three publicly listed SFR REITs (Invitation Homes, American Homes 4 Rent, and Tricon Residential) own a combined 180k+ homes. All three were founded in 2012 and began acquiring properties in the early recovery period following the 2008 global financial crisis; Invitation Homes scaled most aggressively, buying ~40,000 homes in 2012-2013 alone.
The Sun Belt has been a popular acquisition target for these SFR REITs, offering attractive underlying population and employment growth paired with reasonably priced homes relative to prevailing rental yields. These days, acquisition pace has slowed with funds struggling to find properties that offer attractive yields, driven by fewer homeowners being willing to sell and larger holding costs associated with higher interest rates. However, demand for SFR units from renters remains strong, and market conditions have driven a rise in interest for built-to-rent (BTR) projects.
Data Overview
At SFR Analytics, we leverage nationwide deed, assessor, and rental listing data to track the single family rental market. To generate this analysis, we’ve:
Identified and reconciled the entities that INVH, AMH, and TCN have purchased homes under.
Matched rental listing data to the underlying ownership information that links an entity to a fund.
Aggregated additional sources of data, like school ratings, to provide additional context about the neighborhoods where properties are held.
Note: A more detailed breakdown of data and methodology used is available at the bottom of the post.
Analysis & Results
Geographic Distribution
INVH

INVH has built an 84,000+ home portfolio spanning the county, with major presence in the Southwest and Southeast. Invitation Homes owns the most homes by state in Florida, accounting for almost a third of its portfolio. After Florida, Georgia and California are the next largest states by holding, each having over 11,000 properties.
AMH

AMH has built a 58,000+ home portfolio. Compared to INVH, AMH has a larger presence in the Midwest, with almost 10% of the portfolio in Ohio and Indiana alone. American Homes 4 Rent has a more even distribution of properties owned by state with Texas, Florida, and North Carolina all having over 8,000 properties. AMH owns 6,670 properties in Georgia and a few thousand each in Tennessee, Arizona, Ohio, etc.
TCN

TCN has built a 38,000+ home portfolio, mostly concentrated in the Southeast. Outside of Indiana, where Tricon owns 1,800+ properties, Tricon doesn’t own any homes in the Midwest. Tricon owns most of its properties in Georgia, Texas, Florida, and North Carolina, with the four states accounting for almost 70% of the funds portfolio.
Purchase Price Distribution


School Ratings
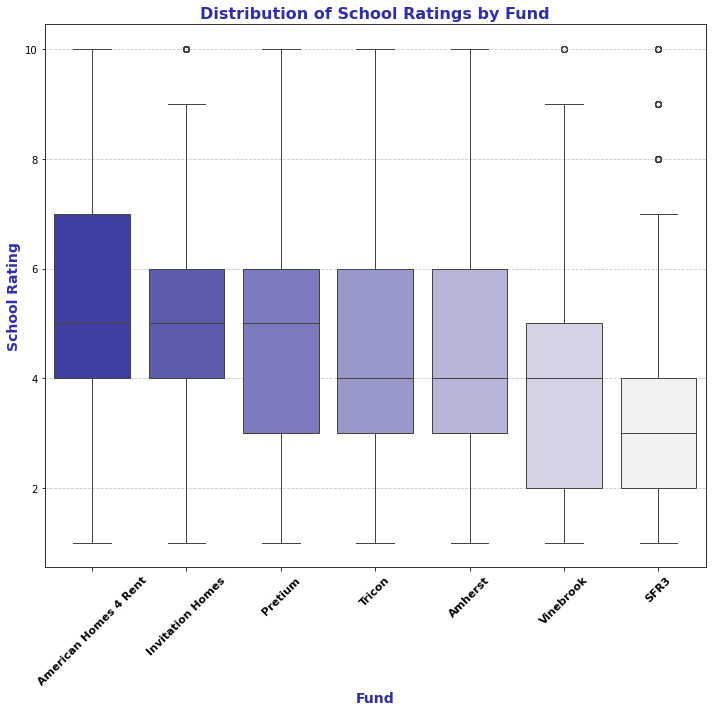
Invitation Homes and American Homes 4 Rent have a higher median GreatSchools rating for schools near portfolio properties, slightly ahead of Tricon. Workforce housing providers like VineBrook and SFR3, which focus on affordability, have notably lower distributions of GreatSchools ratings.
Fund-Level Rent Growth and Listings Price Cuts
Property-level purchase and sale activity combined with rental listings history can be aggregated to create real-time estimates of new lease rent growth across the portfolios of SFR REITs.
At a high-level, the calculation is set up by looking at properties that have been listed and delisted two or more times since purchase and comparing the delisting price of the initial period on market to the subsequent period on market and annualizing the rate of change in price. Pairs of listings with a short duration between removal and relisting are excluded, as these are assumed not to reflect actual rental agreements.
Having access to this information in real-time is helpful for investors evaluating these companies ahead of quarterly earnings to get a sense for how new lease rent growth (and by extension, portfolio-wide rent growth) is tracking, a key KPI driving earnings or for SFR operators to see how their own portfolio is doing in comparison.
Note: the remainder of this article is available to paid subscribers, sign up below for access. Paid subscribers get full access to weekly data-rich articles about the SFR market and select additional articles only available to paid subscribers.