

Looking Back at Redfin's iBuying Program
A data-driven post-mortem of Redfin's iBuying venture and what it means for the future of real estate transactions
Introduction
Rocket Companies recently announced its acquisition of Redfin in an all-stock deal valued at $1.75 billion. As Redfin joins Rocket's operations, it's an opportune time to analyze one of the less successful aspects of Redfin's business: RedfinNow, its direct home buying and selling operation that operated from 2017 until November 2022.
Like other iBuyers such as Opendoor and Offerpad, Redfin ventured into the capital-intensive business of purchasing homes directly from sellers, making light renovations, and attempting to resell them at a profit. While Redfin ultimately abandoned this strategy amid challenging market conditions, understanding RedfinNow's performance provides valuable insights into the challenges of institutional home flipping and important context for Rocket's acquisition.
Methodology
Our analysis leverages comprehensive transaction data from property records across RedfinNow's operating markets, primarily focusing on:
Transaction identification: Properties purchased and sold by RedfinNow, identified through deed records where the buyer or seller name contains variations of "Redfin" or "RDFN"
Financial metrics: Purchase prices, sale prices, hold times, and calculated gross margins
Geographic distribution: Market-level analysis across Southern California, Texas, and Phoenix
Temporal trends: Quarterly analysis of transaction volumes and performance metrics
Comparative context: Benchmarking against other iBuyers like Opendoor and Offerpad
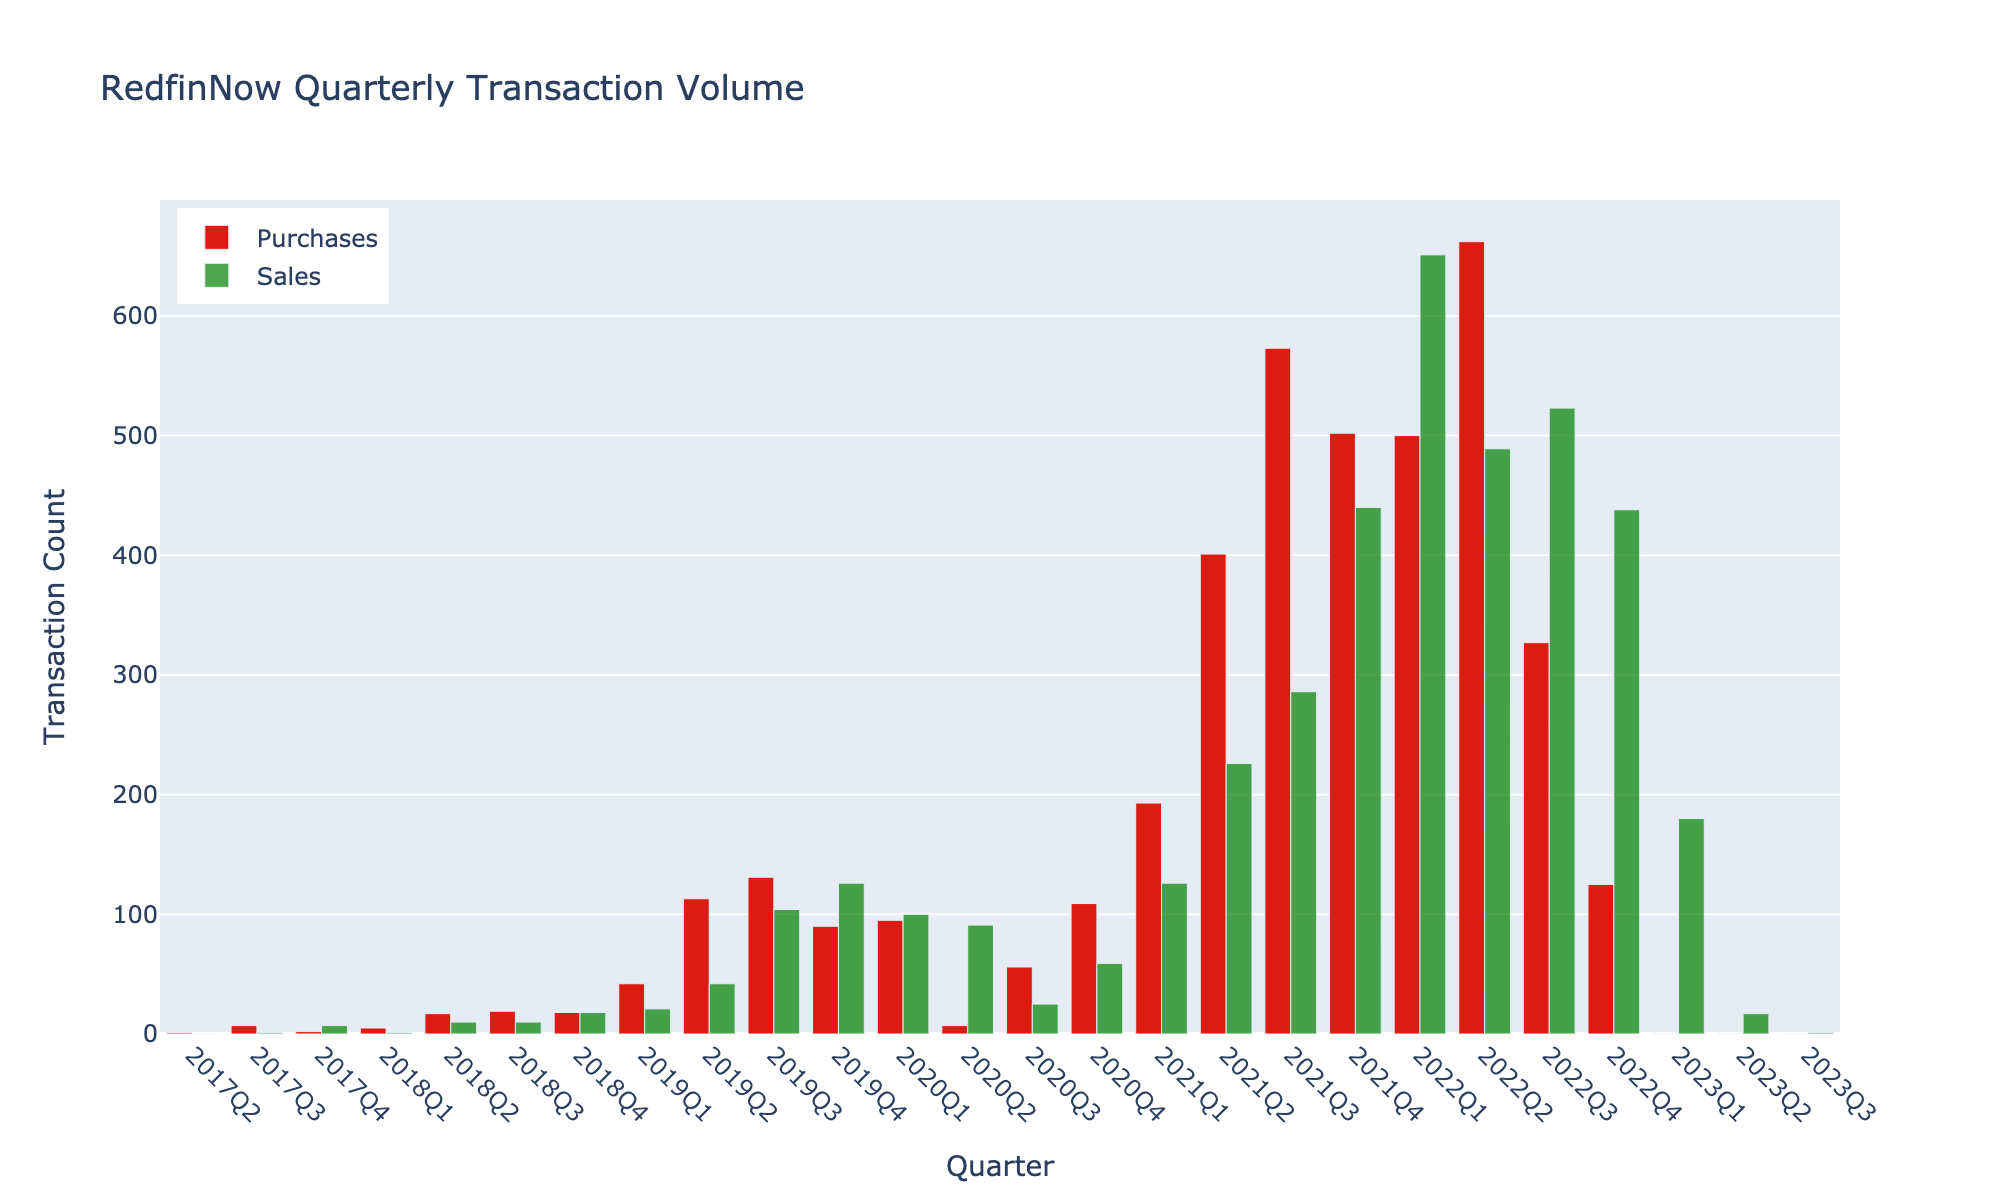
Transaction Volume Analysis
RedfinNow's transaction volume followed a clear trajectory:
2017-2018: Pilot phase with limited transactions (<50 per quarter), primarily in Southern California
2019-2020: Expansion phase with steady growth reaching 100s of purchases per quarter
2020 (Q2-Q3): COVID-related pause and cautious restart
2020 (Q4)-2022 (Q3): Aggressive expansion reaching peak quarterly acquisition volume of ~800 homes in Q3 2021
2022 (Q3): Rapid deceleration as market conditions deteriorated, with final purchases in Q4 2022
Our data reveals a total of ~4,600 RedfinNow purchased — which were primarily in non-core iBuyer markets like Washington DC, California, and Seattle.
When comparing RedfinNow's volume to other major iBuyers, we see Redfin's more conservative approach:

Financial Performance
RedfinNow's financial performance metrics reveal several insights: