Institutional Purchases of Opendoor Properties Down 95%
An overview of who is buying properties sold by Opendoor, broken down by time period, region, and buyer type.
Executive Summary
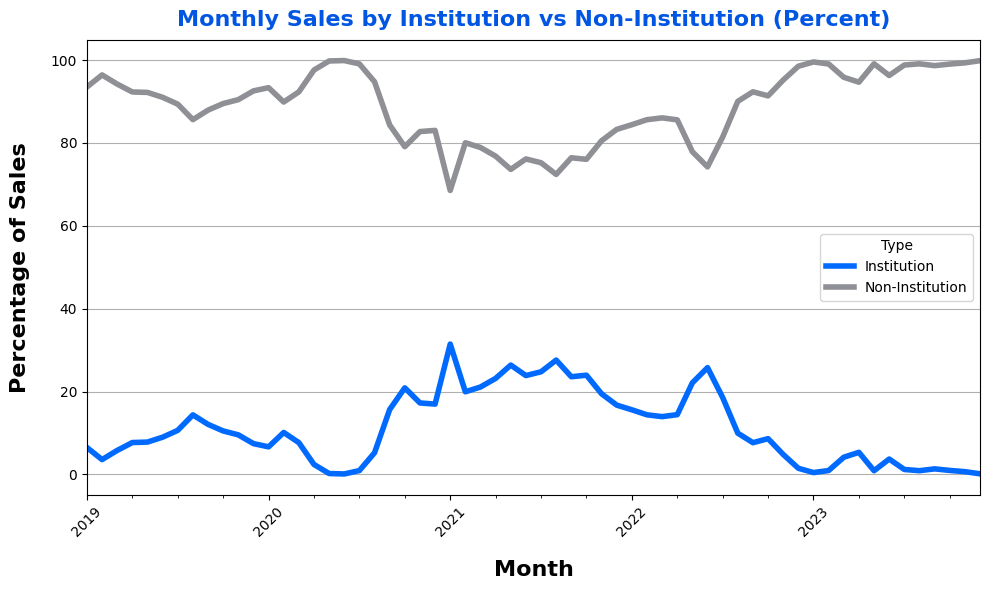
The type of buyer for homes sold by Opendoor has changed significantly. In June 2022, over 25% of homes sold by the company were purchased by institutional investors; in 2023, less than 3% of all properties were sold to institutional investors.
Since Opendoor began operations, three institutional investors — First Key, Pretium, and Tricon — have each purchased more than 1,000 homes, while 19 other investors have acquired over 100 homes each. In 2023, Pretium was the only institution to purchase more than 100 homes from Opendoor; in 2022, 14 different institutions purchased more than 100 properties and in 2021, 11 different institutions purchased more than 100 properties.
Detailed information breaking down the level of institutional participation by metro area and institution name is available at the end of the article. Participation varied significantly by geo and time period; in some regions, institutions bought over 50% of homes sold. Institutional participation going forward may be a key factor in the performance of Opendoor’s business.
Interested in seeing the full dataset showing institutional purchases of Opendoor properties? Send us an email at support@sfranalytics.com or reply to this email.
Introduction
Opendoor has developed a consumer-friendly way for homeowners to sell, making digital “instant offers” and closing quickly with no work on the homeowner’s part to prep the home for showings. Using a debt facility, Opendoor holds these properties on its own balance sheet and performs light renovations before later selling the properties. The company relies on significant engineering and analytics work to automate the offer making process and manage financial exposure risk. These days, the company buys more than 1,000 homes per month across dozens of markets nationwide, making them the largest homebuyer in the United States.
Using transaction-level deed data along with significant entity matching and reconciliation of assessor data, we looked at end buyers for homes sold by Opendoor dating back to January 2022 to get a sense for the profile of buyer and how it’s changed over time.
For a detailed breakdown of the recent performance of Opendoor, view our post covering Opendoor’s unit economics improvement. For more about the types of homeowners that sell to Opendoor, view our recent post breaking down seller personas.
Data Overview
At SFR Analytics, we leverage nationwide deed, assessor, and demographic data to track the residential real estate market. To generate this analysis, we’ve:
Identified and reconciled the entities that Opendoor purchases homes under.
Identified and reconciled the entities that SFR funds have purchased homes under.
Analysis & Results
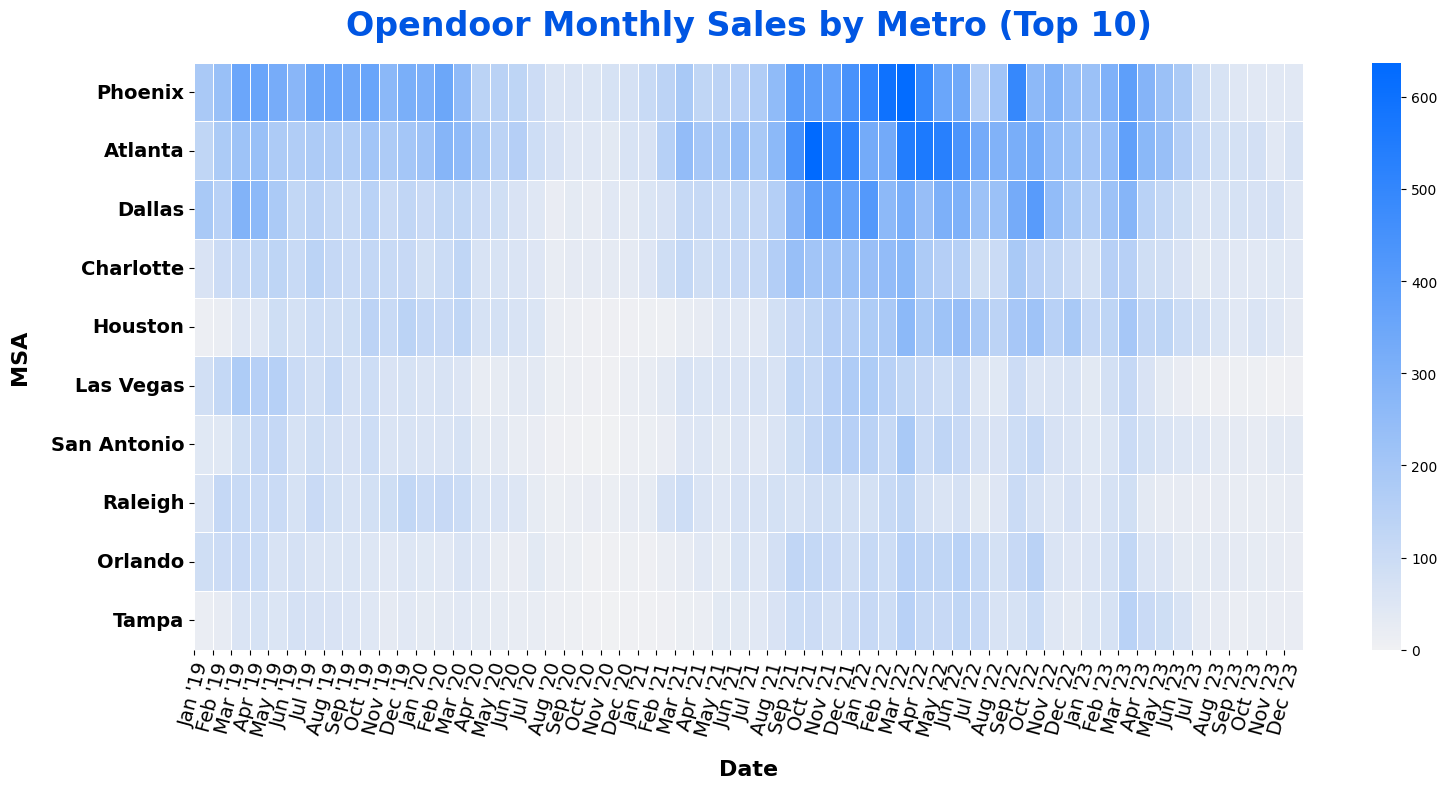
Opendoor Sales by Month by Metro
Opendoor’s largest markets have been Atlanta, Phoenix, and Dallas. With unit economics poor on properties purchased in the first half of 2022, the company pulled back on buying, leaving fewer homes on the balance sheet and less to sell in 2023.
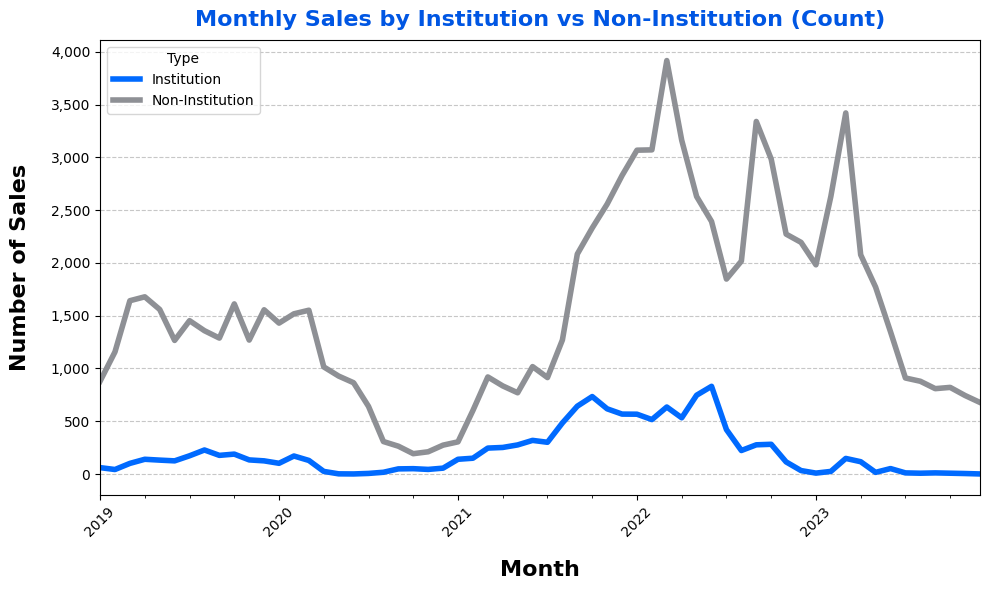
Purchases by Institution vs Non-Institutional Buyers
Institutional purchases (defined as legal entities that own more than 100 properties) represented a major destination for properties sold by Opendoor from late 2020 to early 2022. For almost all of 2021, institutional purchases represented 20%+ of homes sold. With the rise in interest rates in 2022, SFR funds backed away, dropping to below 3% of purchases in 2023.
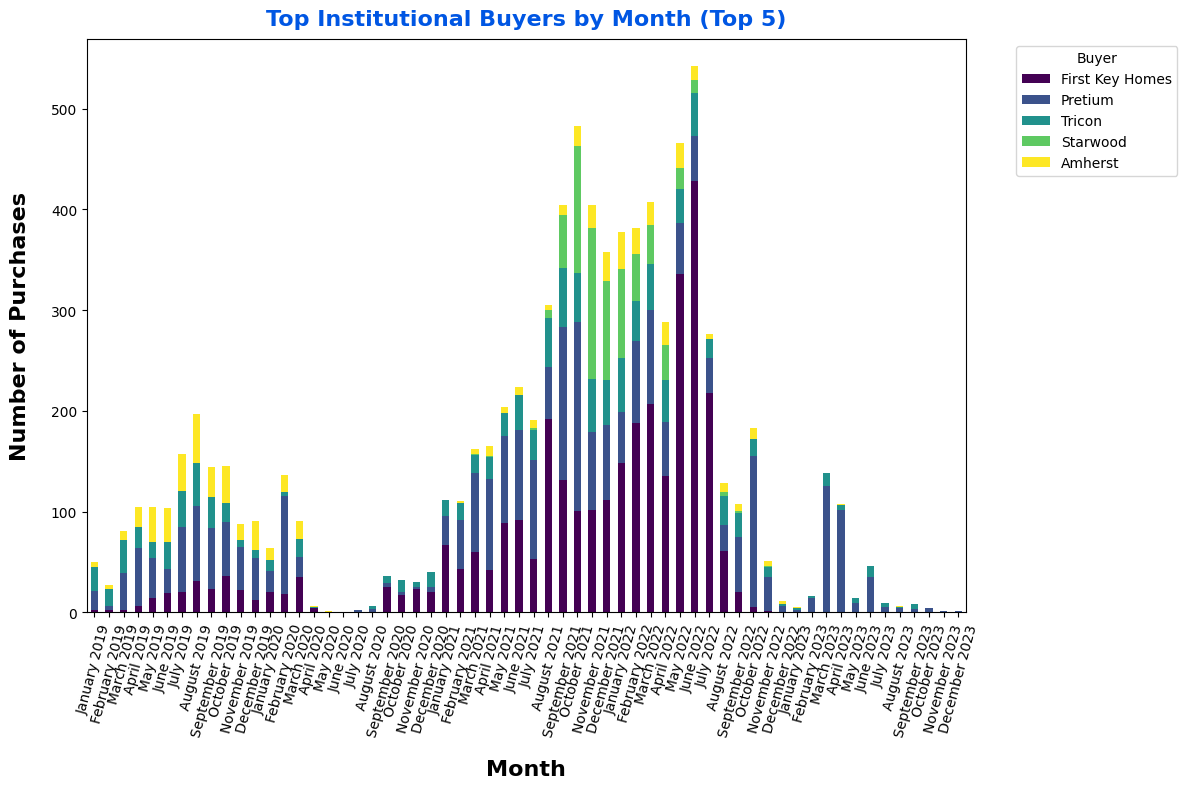
Count by institution by month
While Opendoor has sold properties to many different SFR funds, a small handful have made up the bulk of the purchases. First Key Homes and Pretium alone have accounted for almost half of the properties sold to institutions. Including Tricon, Starwood, and Amherst takes the coverage up to two thirds of properties sold to institutions.
Market-Level Details
While institutional purchase activity has played a role in Opendoor’s business nationwide, some geographies have had larger participation than others. With the swift change from high volume purchase activity by institutions to almost stopping purchases entirely, some regions were left particularly vulnerable to the pull back.
Note: the remainder of this article is available to paid subscribers, sign up below for access. Paid subscribers get full access to weekly data-rich articles about the SFR market and select additional articles only available to paid subscribers.


