


2023 State of the Private Lending Market
Top lenders, market commentary from active lenders, metros with largest changes in activity, borrower loyalty, and more.
Executive Summary
Private lending activity was down 30%+ in 2023 compared to 2022; since reaching a low in January 2023, activity held flat to slightly positive.
After a slow year in 2023, lenders are optimistic about the year ahead. While many expect consolidation amongst originators, they largely expect origination volume to grow.
Kiavi is the leading nationwide provider of fix-and-flip loans, holding the #1 market share position in 25 different markets as of December 2023.
Private lending regionally continues to be served by a long-tail of providers, with almost all regions having 50+ lenders completing 10+ loans in 2023.
At the end of the article, paid subscribers have access to lender-level breakdowns of activity (including churn rate by lender) and borrower history lists generated by the SFR Analytics Private Lender Tool.
SFR Analytics Private Lender Tool
Interested in being able to track private lender activity nationwide in real-time, including getting access to borrower lists for each lender with borrower contact information? Reach out to support@sfranalytics.com for a demo of the SFR Analytics Private Lender Tool.
The only private lender analytics software that offers nationwide coverage, supporting every metro in the US.
In addition to tracking private lending activity, the tool also provides coverage of:
Cash buyers
Current holdings for an entity
Verified contact information for thousands of borrowers nationwide
Dozens of originators choose the SFR Analytics Private Lender tool to close more deals, enter new metros successfully, and get a better real-time view of the market.
Market Commentary
SFR Analytics works with lenders nationwide; brief color shared below is based on regular conversations we have with them.
Despite 2023 being a slow year for many lenders—especially compared to 2021-2022—we've heard strong optimism about the year ahead.
Based on our conversations and market data, here are a few things we think might happen this year:
Consolidation: we’ve been hearing a few originators plan to start acquiring other originations, while a few are prepping themselves for sale.
Increase in origination volume: mostly driven by anticipation of rate drops, many lenders we talk with are expecting their business to grow significantly in 2024.
Increased focus on “Tier 3” borrowers: Tier 3 borrowers are borrowers who are taking out a few loans per year. Many lenders recognize that it’s difficult to compete with Kiavi and other large scale originators due to their cost of capital and willingness to compress margins to win volume. One strategy we’re hearing lenders excited about is pursuing borrowers who are relatively small, but who are looking to grow significantly in the coming years. By working with these borrowers early, lenders hope to win a share of future business as they grow before it’s competed for by large originators.
Data Overview
At SFR Analytics, we leverage nationwide deed and assessor data to track the single family rental market. To generate this analysis, we’ve:
Identified and reconciled the entities that private lenders make loans under
Identified and reconciled the entities that investor purchase properties under
While the data used is primarily residential, some commercial originations are also included
Analysis & Results
Nationwide Activity
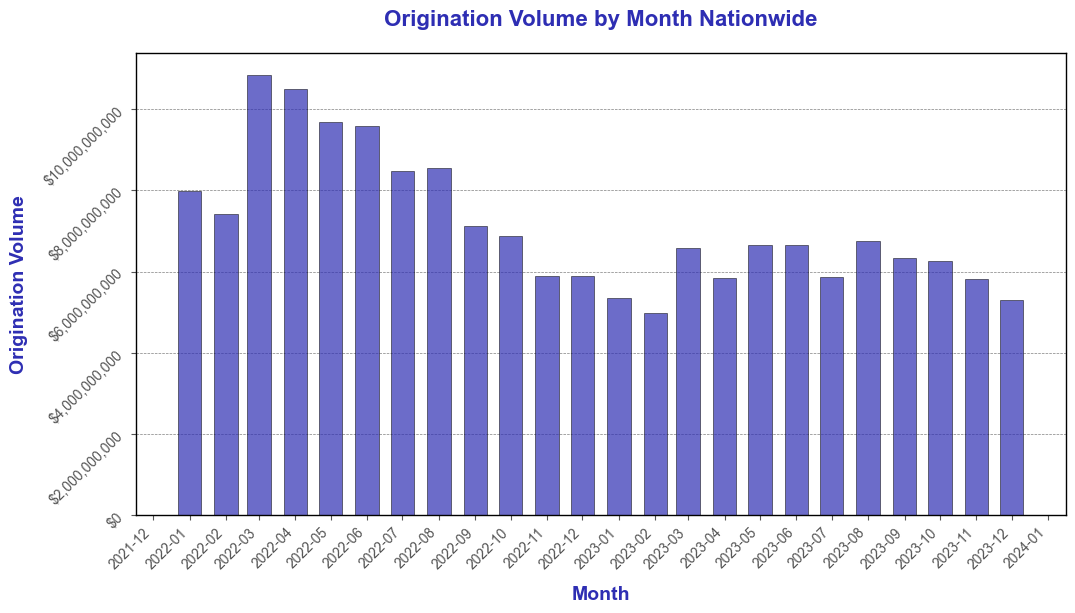
Private lending activity is down significantly in 2023 compared to 2022, falling 30%+ from the peak in activity in H1 2022.

Despite the drop off in volume, average origination size has held steady from 2022 through 2023.

Part of the decline in origination volume can be explained by property investors exiting the market or slowing down and no longer taking loans, shown by the decrease in the number of unique investors taking out a loan in a given month.
Largest Regions by Loan Origination Volume
The largest regions by loan origination volume were Los Angeles, New York, Miami, Phoenix, and Dallas/Fort Worth.


MSA: Best YoY Origination Volume 2023 vs 2022
New Haven (+13%)
Cape Coral (-5%)
Providence (-11%)
MSA: Worst YoY Origination Volume 2023 vs 2022
Sacramento (-64%)
Indianapolis (-64%)
Urban Honolulu (-71%)
Largest Lenders Most Negatively Impacted
Of the 49 lenders who did more than 1,000 loans in 2022, only three grew year-over-year, with American Heritage growing the most by closing 70% more loans in 2023 than 2022
Of the 518 lenders who have done more than 100 loans, 22% grew year-over-year. The lenders that grew were primarily local or regional lenders who have the top three market share in the regions where they operate.
Kiavi Market Position Over Time

Kiavi continues to be the leading nationwide fix-and-flip lender, ranking #1 in market share across 25 different MSAs profiled as of December 2023.
Local Dominance In Some Markets
Despite Kiavi being the largest nationwide fix-and-flip lender, there are regional lenders with top market share in a few key markets.

In Portland, Rain City has been the largest lender in 2023, capturing 10%+ market share.
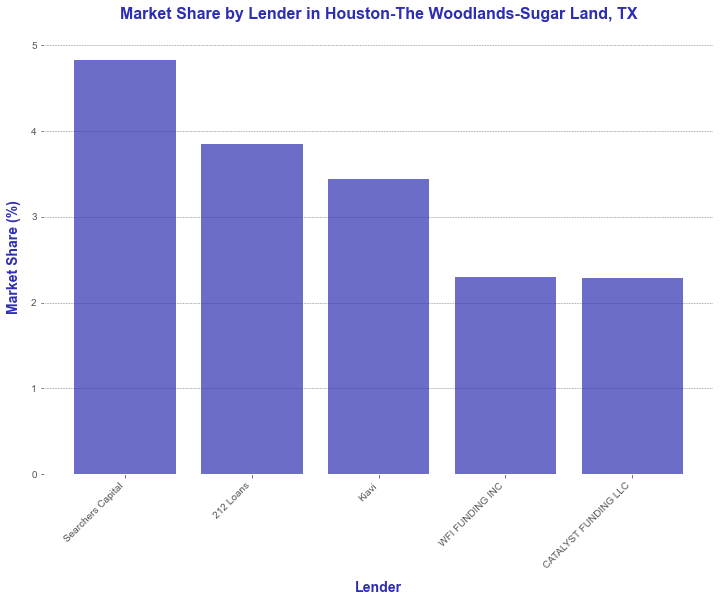
In Houston, Searchers Capital has captured the top market share position, edging out 212 Loans and Kiavi with a market share of almost 5%.

In 2023, many lenders pulled back from Phoenix, leaving Capital Fund significant room to capture market share and growing to almost 15% of the market.
Distribution of Active Lenders by MSA
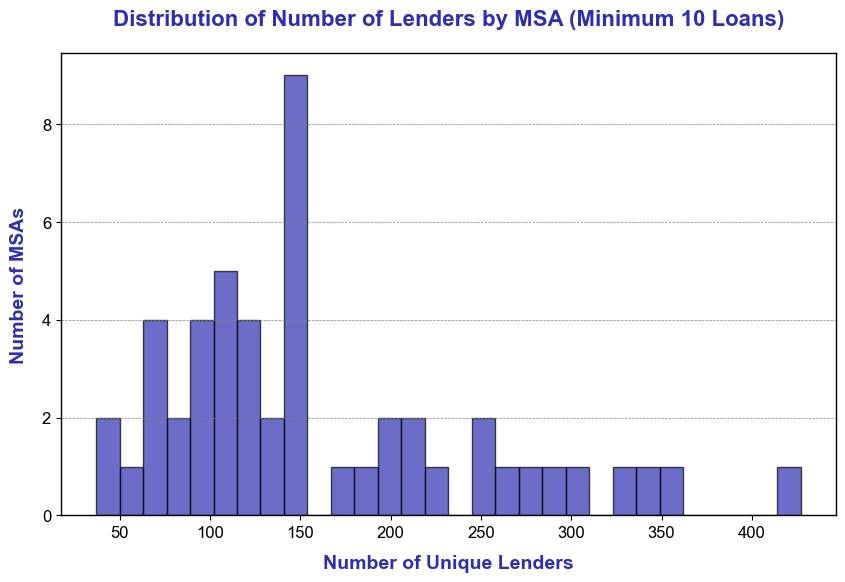
Private lending supports a long tail of active lenders within MSAs. Most MSAs had 100+ unique lenders completing 10+ loans over the period Jan 2022 to November 2023.
Lender Activity & Borrower Lists
Using the SFR Analytics Private Lender Tool, we’ve pulled lender-specific activity along with churn rates for top lenders and the largest borrowers from top lenders.
Note: the remainder of this article is available to paid subscribers, sign up below for access. Paid subscribers get full access to weekly data-rich articles about the SFR market and select additional articles only available to paid subscribers.